
Call it a crisis in home cooking: Recent research indicates roughly half of Americans hate preparing their own meals and opt to eat out whenever possible. But in kitchens across the country, the state of cookery is far more complicated. Just consider the runaway success of meal kit delivery services or the viral appeal of Tasty videos. Clearly, our culture doesn’t entirely lack culinary enthusiasm.
Here’s one potential explanation of this contradiction: Home cooking may be on the decline because people lack the necessary tools. Experts say millennials are particularly likely to be missing basic cooking equipment, such as pots and pan. Plus, there’s a colossal market for devices that make home cooking more convenient: The cult of Instant Pot is no accident. Could improved tools and tech be key to restoring the culinary bug across the country?
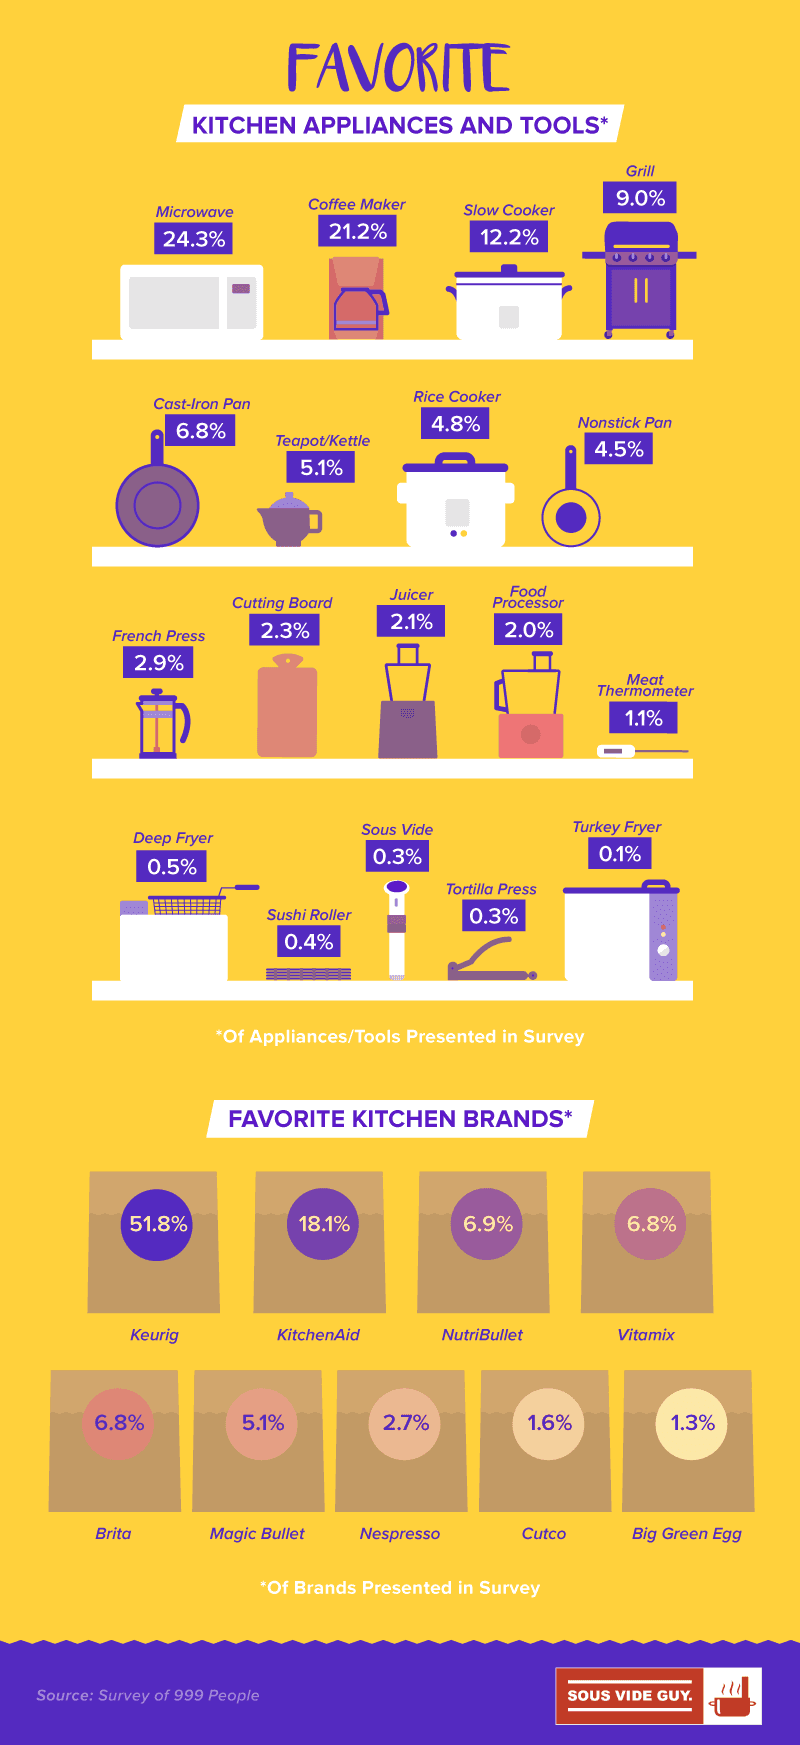
In this project, we surveyed roughly 1,000 individuals about the culinary tools and devices we’d find in their kitchens. Our findings reveal which cooking gadgets people use most often, and which actually deliver deliciousness – an intimate look at how we actually feed ourselves. For a firsthand look at the devices and brands dominating home cooking, keep reading.
Common in the Kitchen
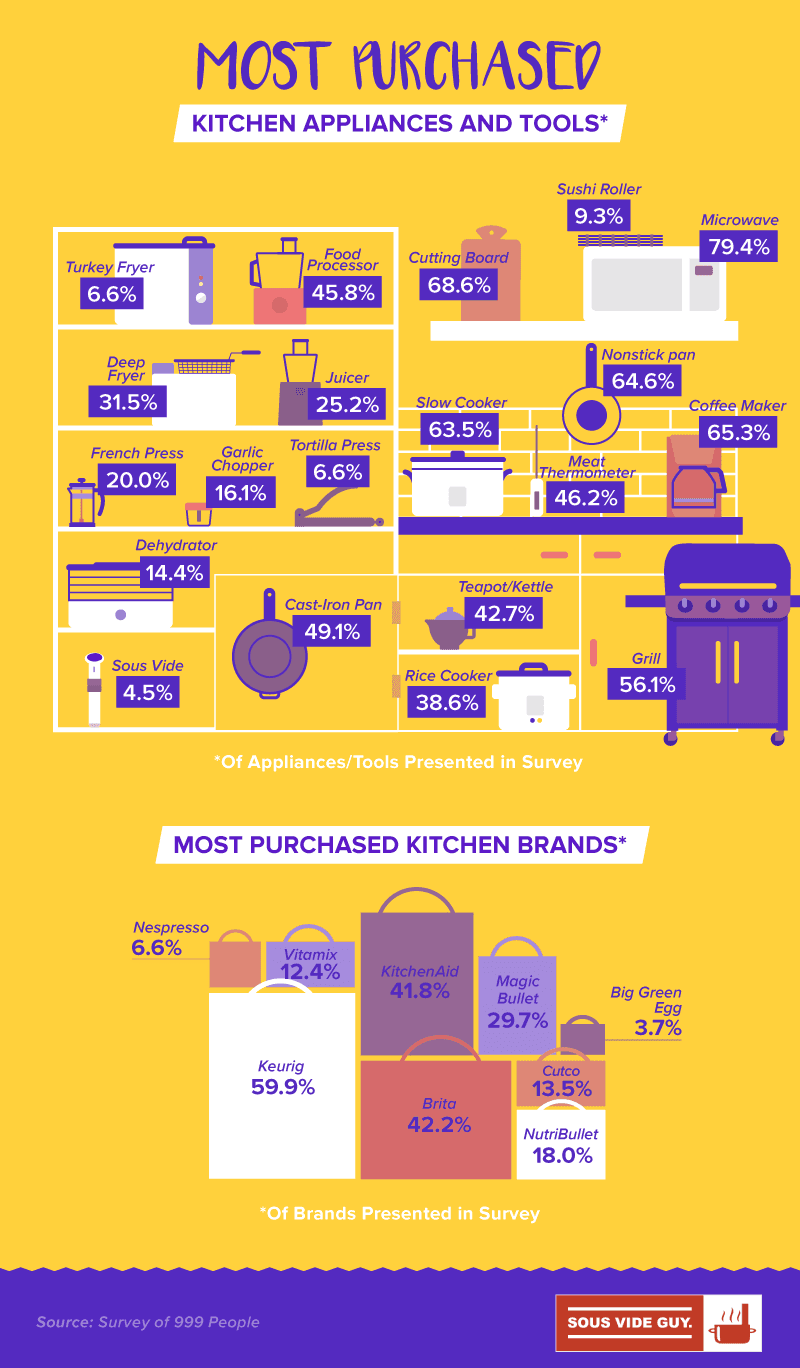
Since its invention in 1947, the microwave has transformed Americans’ approach to preparing meals – and shifted the content of our cuisine in the process. Of all the cooking tools and devices included in our survey, it was the gadget our respondents possessed most often. In fact, respondents were significantly more likely to own a microwave than pans of either the nonstick or cast-iron variety. Perhaps people simply enjoy alternatives to stove-top cooking: Sixty-four percent owned a slow cooker, and 56 percent owned a grill. Then again, heat sources with more specific functionality were substantially less popular. Fewer than 40 percent owned a rice cooker or deep fryer, and turkey fryers were especially rare. Sous Vide appliances, while relatively niche, are growing in popularity and were owned by nearly five percent of respondents.
Keurig was the most commonly owned brand; it seems many are extracting their java from K-Cups each morning, although about 7 percent had a Nespresso machine. Roughly 4 in 10 respondents owned Brita products, and nearly as many owned a KitchenAid mixer. Competing blender brands were also quite common: While NutriBullet and Vitamix were well-represented, the Magic Bullet seems to have the upper hand in terms of market share. Additionally, nearly 14 percent of people owned Cutco knives – thanks no doubt to the company’s legion of “sales contractors” who sell their wares door to door.
Popular Appliance Prices
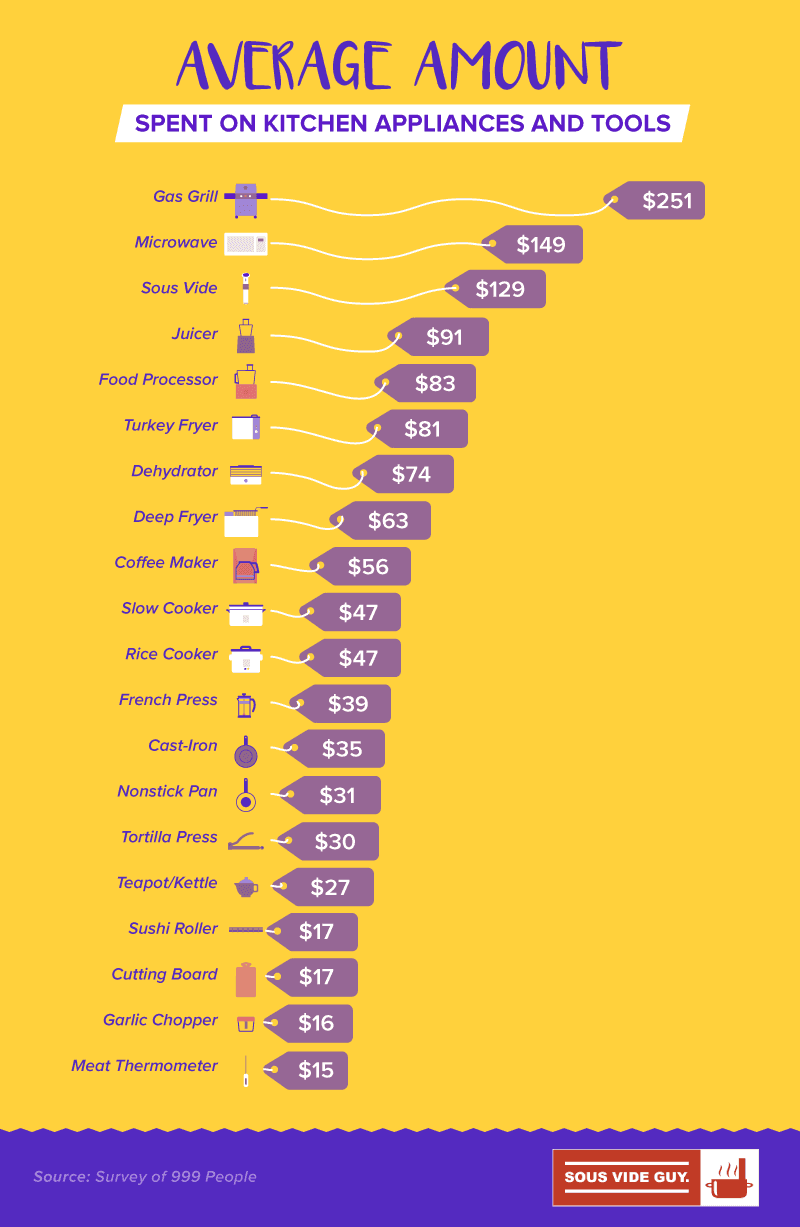
Of course, price is a key factor in a given appliance’s popularity, and some gadgets cost a pretty penny. Big Green Egg grills were the most expensive cooking device overall, though at an average price of $286, our respondents got a great deal relative to the cost of a brand-new model. Gas grills could also be expensive, running respondents $251 on average. Vitamix blenders were the only other devices to cost more than $250 on average: The brand has long offered a price point well above its competitors, claiming its blenders’ performance and longevity justify the added expense. The NutriBullet, for example, cost respondents about $200 less on average.
In some cases, price distinctions seem to correlate with differences in device popularity. As noted above, more people owned coffee makers from Keurig than from Nespresso, and the latter company’s devices were $25 more expensive on average. On the other hand, some brands were iconic enough to achieve widespread popularity while keeping prices relatively high. This seemed to be the case with KitchenAid Mixers, which many regard as a requirement of a well-furnished kitchen. Similarly, Cutco knives cost $232 on average, though there are plenty of less expensive optionsavailable from online retailers.
Go-To Kitchen Gadgets
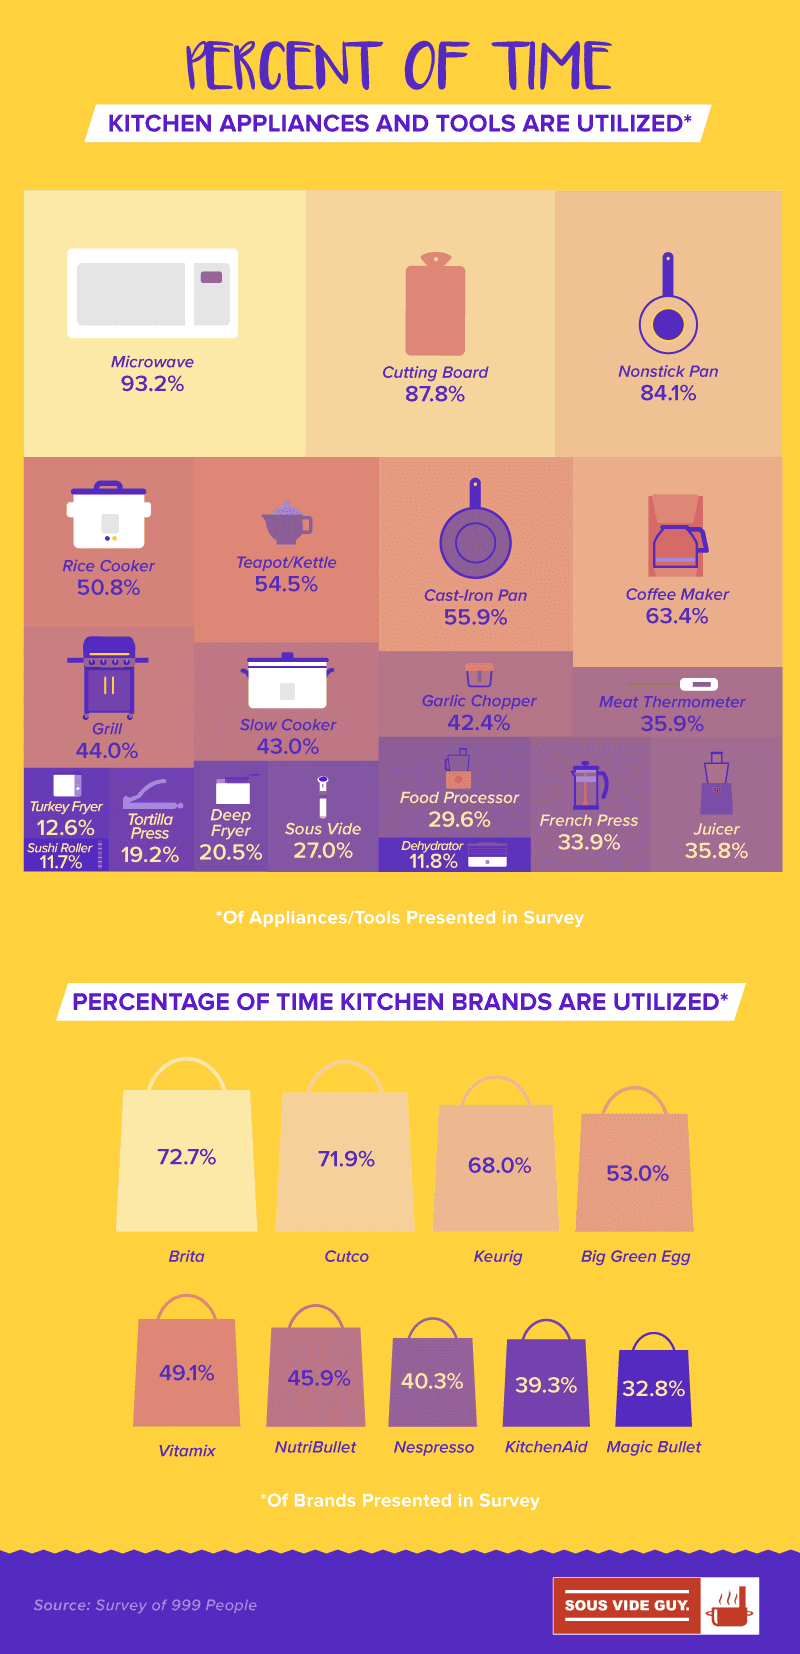
Simply owning a kitchen gadget is no guarantee it will get regular use – daily life often impedes grand plans of culinary experimentation. Indeed, our respondents were most likely to use very basic kitchen accouterments most frequently, and the microwave, once again, took the top spot, followed by cutting boards and nonstick pans. Interestingly, rice cookers and tea kettles were also some of the most frequently used kitchen devices. As noted above, less than half of respondents had purchased these gadgets, suggesting those who have them are often power users.
Brita was the most-used kitchen brand in our data: After all, water is a frequent need. Cutco and Keurig offerings ranked second and third respectively – without cutting or coffee, what is a kitchen anyway? But the appearance of Big Green Egg grills in the fourth spot was something of a surprise. Though one typically associates grilling with weekend barbecues, the self-proclaimed “Eggheads” who swear by this product must put it to more frequent use. Blender makers Vitamix and NutriBullet were next in the ranking of most-used brands, followed by Nespresso in the seventh spot overall.
Satisfaction by Contraption
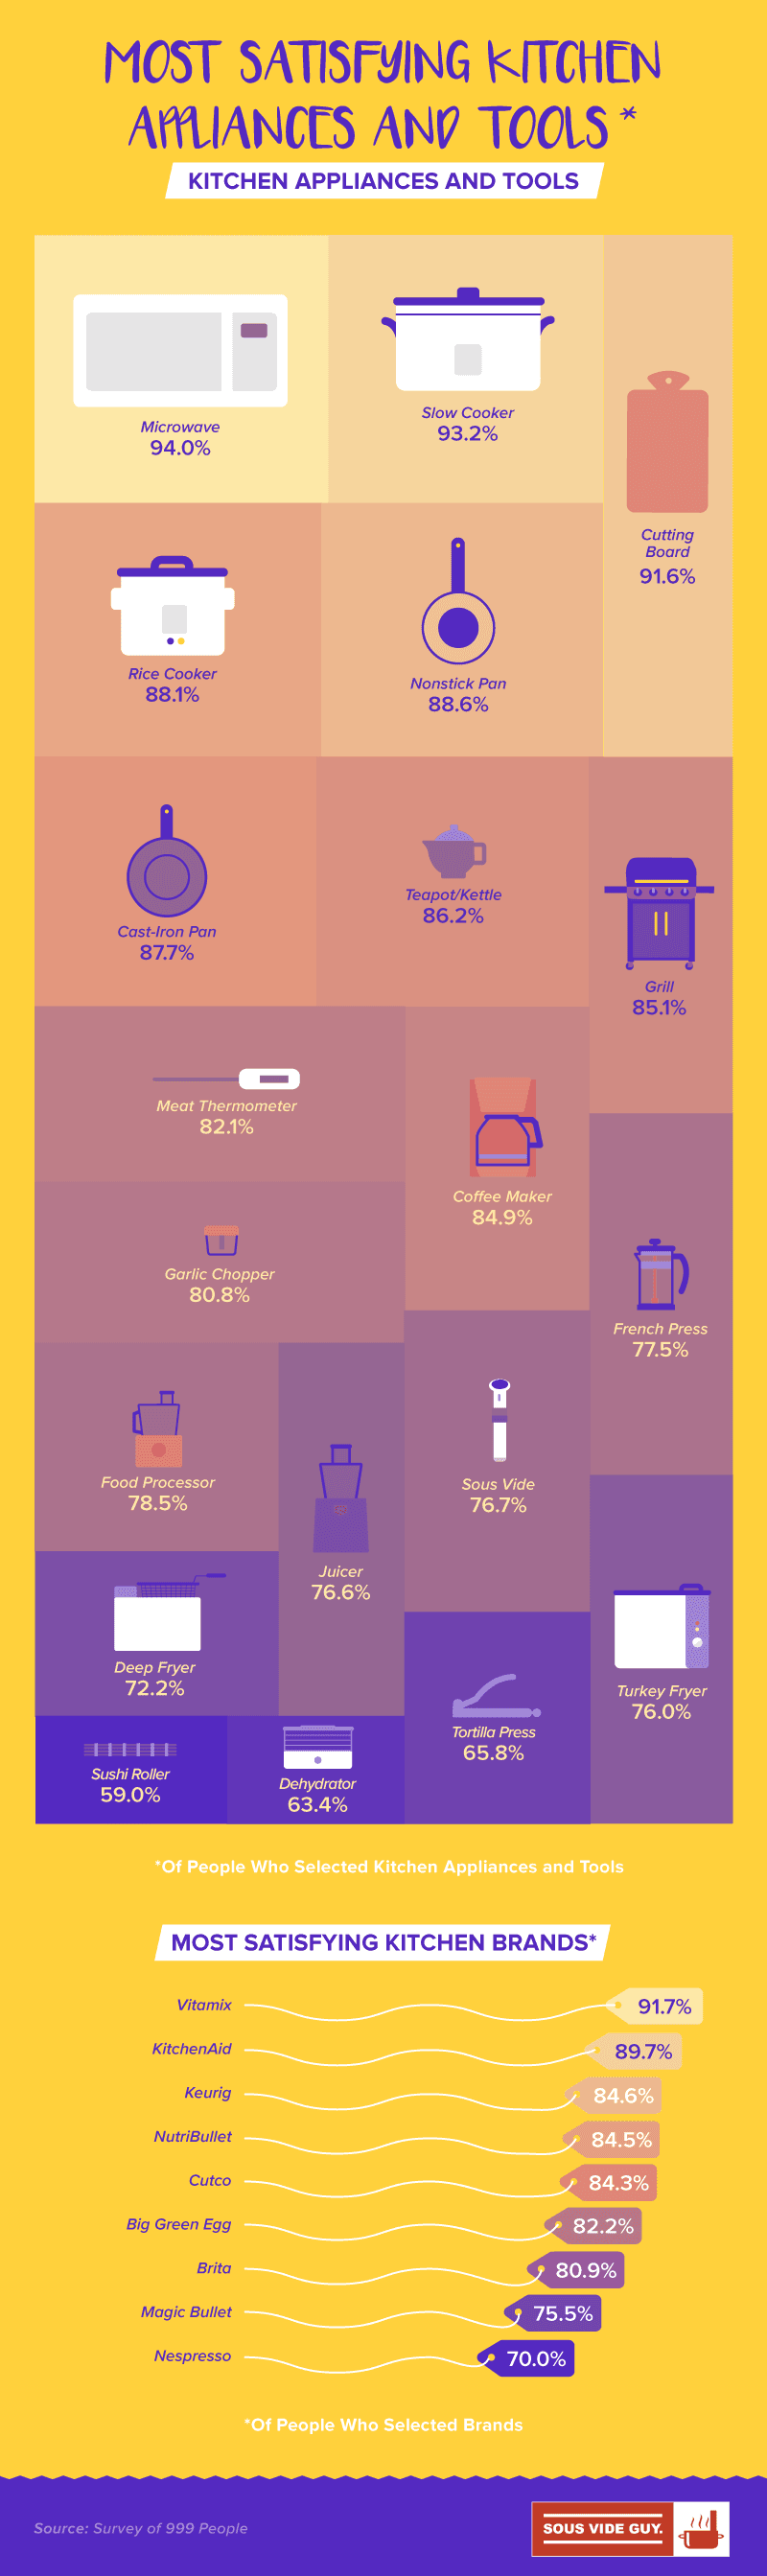
Satisfaction is best served swiftly: Our respondents found the microwave the most satisfying kitchen contraption overall. Then again, delaying gratification also has its pleasures, with slow cookers ranking second in this category. This feeling of contentment may explain the explosive success of the Instant Pot, though the term slow cooker does not do justice to that device’s remarkable versatility. Old-school methods of applying heat delivered significant satisfaction as well, however: Nearly 90 percent of respondents said non-stick and cast-iron pans were among the most satisfying kitchen tools to use.
As brands go, Big Green Egg grills trumped all others in driving satisfaction. That could relate to the appeal of the grilling experience more generally: Eighty-five percent rated gas grills as satisfying as well. Conversely, turkey fryers delivered the least satisfaction by far. Perhaps a contraption used exclusively on Thanksgiving is doomed to feel underwhelming, but that lack of satisfaction could relate to anxiety instead. Turkey fryers can produce disastrous results if the bird in question isn’t properly thawed before it hits the oil.
Our Dearest Devices
We’ve covered popularity, price, frequency of use, and satisfaction, but the most relevant question related to these gadgets may be the most simple: Which devices and brands were our respondents’ favorites? While the microwave triumphed once again, other results suggested more affection for the cooking process itself. Slow cookers and grills were among the most beloved items, for example. So were cast-iron pans, which can take some serious elbow grease to care of but can acquire a distinctive character over time.
Then again, Keurig’s quick and convenient take on coffee made it the most beloved kitchen brand overall. And with 64 percent of Americans downing cups of joe daily, perhaps it’s no surprise coffee makers were the second-favorite type of device overall. KitchenAid ranked second among all kitchen brands, followed by NutriBullet and Vitamix. Though the two blender competitors were virtually tied, it’s interesting to see the cheaper NutriBullet slightly outperform its pricey rival.
Culinary Tools You’ll Actually Use
Our findings reveal a deep devotion to certain kitchen devices, particularly those that represent advances in convenience. And while the microwave may drive much of our eating at home, our respondents’ enthusiasm for more artisanal appliances should make even the biggest fans of frozen meals reconsider their repertoires. As culinary tech continually improves, a single new device can bring a broad array of flavors into your kitchen and break your takeout dependence. That’s a transformation that your wallet and palate can appreciate equally.
Fair Use Statement
If you’d like to share our findings on your own site or social media, you’re free to do so for noncommercial purposes. If you do, simply link back to this page to attribute our team for our efforts. Just like any accomplished (or aspiring) chef, we appreciate a little credit for our creations.